Top 5 Technical Analysis Indicators 2025 | Trading Guide
The Ultimate Technical Analysis Guide for 2025: Master These 5 Indicators to Transform Your Trading
Reading Time: 12 minutes
The world of trading has evolved dramatically since the days of shouting on exchange floors and handwritten charts. What once required years of apprenticeship and insider knowledge is now accessible to anyone with a smartphone and the right understanding of technical analysis.
As we navigate through 2025, the question isn’t whether technical analysis works – it’s how quickly smart traders will master these time-tested tools to gain their competitive edge. If you’re still making trading decisions based on gut feelings or hot tips from social media, this comprehensive guide will show you why the most successful traders rely on data-driven technical indicators.
Key Trading Insights for 2025
📊 Data-Driven Decisions Are Everything
Professional traders don’t gamble – they calculate. Technical indicators provide the statistical edge that separates consistent winners from emotional losers in today’s markets.
⚡ Speed and Precision Matter More Than Ever
With algorithmic trading dominating volume, retail traders need sharp technical skills to identify opportunities before they disappear. The right indicators help you act faster and more accurately.
🎯 Risk Management Is Your Superpower
Technical analysis isn’t about predicting the future – it’s about managing risk while maximizing opportunity. The traders who survive and thrive understand this fundamental truth.
💡 Technology Amplifies Traditional Methods
Modern trading platforms and real-time data have made technical analysis more powerful than ever. The tools are better, the data is faster, and the opportunities are bigger.
Why Technical Analysis Is More Relevant Than Ever
The financial markets have become increasingly complex, but human psychology remains remarkably consistent. Technical analysis works because it captures the collective emotions and behaviors of market participants – fear, greed, hope, and despair – all reflected in price movements and trading patterns.
The Professional Trader’s Secret Weapon
Walk into any professional trading floor, and you’ll see the same thing: screens filled with charts, indicators, and technical patterns. These aren’t decorations – they’re the essential tools that separate profitable traders from the 90% who lose money.
Professional traders understand that fundamental analysis tells you what to buy, but technical analysis tells you when to buy it. In today’s fast-moving markets, timing is everything.
Why Emotional Trading Fails Every Time
Human emotions are the enemy of profitable trading. Fear makes us sell at the bottom, greed makes us buy at the top, and hope keeps us in losing positions far too long. Technical indicators provide an objective framework that removes emotion from your trading decisions.
When you have clear, data-driven signals telling you when to enter and exit trades, you don’t need to rely on feelings or guesswork. You follow the plan, manage your risk, and let the probabilities work in your favor.
The 5 Technical Indicators Every Serious Trader Must Master
Smart traders understand that technical analysis isn’t about using every indicator available – it’s about mastering the right indicators and understanding how they work together. These five tools form the foundation of professional technical analysis.
1. Moving Averages: Your Market GPS System
Moving averages are the backbone of technical analysis, and for good reason. They smooth out price noise and clearly show you the direction of the trend. Think of them as your market GPS – they tell you where the price has been and where it’s likely heading.
Simple Moving Average (SMA) calculates the average price over a specific number of periods. It’s straightforward and reliable, making it perfect for identifying major trends.
Exponential Moving Average (EMA) gives more weight to recent prices, making it more responsive to current market conditions. Professional day traders often prefer EMAs for their faster signals.
Professional Trading Strategy:
- Use the 20-day EMA for short-term trend identification
- Use the 50-day SMA for medium-term trend confirmation
- Use the 200-day SMA for long-term trend analysis
- When price is above all three averages, you’re in a strong uptrend
- When shorter averages cross above longer ones, it signals trend acceleration
Why This Works: Moving averages work because they represent the average opinion of all market participants over a given time period. When price consistently stays above a moving average, it shows that buyers are in control. When it falls below, sellers have taken charge.
2. Relative Strength Index (RSI): Your Momentum Radar
RSI is like having a momentum radar for any stock or market. It measures the speed and magnitude of price changes on a scale from 0 to 100, giving you early warning signals about potential reversals.
The RSI Sweet Spots:
- RSI above 70 = Overbought territory (potential sell signal)
- RSI below 30 = Oversold territory (potential buy signal)
- RSI divergence = Early warning of trend changes
Advanced RSI Strategies: Don’t just buy when RSI hits 30 or sell when it hits 70. Professional traders look for RSI divergences – when price makes a new high but RSI doesn’t, or when price makes a new low but RSI doesn’t follow.
Real-World Application: Imagine a stock that’s been climbing for weeks. The price hits a new high, but RSI shows a lower high than the previous peak. This divergence often signals that the uptrend is losing steam, giving you advance warning to take profits or prepare for a reversal.
3. MACD: Your Trend and Momentum Command Center
MACD (Moving Average Convergence Divergence) is like having a command center that shows you both trend direction and momentum shifts. It’s actually three indicators in one: the MACD line, signal line, and histogram.
The MACD Components:
- MACD Line: Shows the relationship between two moving averages
- Signal Line: Smoothed version of the MACD line
- Histogram: Shows the difference between MACD and signal lines
Professional MACD Signals:
- Bullish crossover: MACD line crosses above signal line (buy signal)
- Bearish crossover: MACD line crosses below signal line (sell signal)
- Centerline crossover: MACD crosses above or below zero (trend confirmation)
- Divergence: Price and MACD move in opposite directions (reversal warning)
Why MACD Is So Powerful: MACD combines trend-following and momentum indicators into one tool. It tells you not just what’s happening, but how strongly it’s happening. This dual perspective makes it invaluable for timing entries and exits.
4. Bollinger Bands: Your Volatility Intelligence System
Bollinger Bands aren’t just lines on a chart – they’re a complete volatility intelligence system. They show you when markets are quiet (bands contract) and when they’re about to explode (bands expand).
The Three Components:
- Middle Band: 20-period simple moving average
- Upper Band: Middle band + (2 × standard deviation)
- Lower Band: Middle band – (2 × standard deviation)
Professional Bollinger Band Strategies:
- The Squeeze: When bands contract, big moves are coming
- Band Walks: In strong trends, price “walks” along the upper or lower band
- Bollinger Bounces: In ranging markets, price bounces between bands
- Breakout Confirmation: Expansion after contraction confirms breakout direction
The Volatility Edge: Most traders think volatility is risk, but professional traders know it’s opportunity. Bollinger Bands help you identify when volatility is about to increase, positioning you to profit from the inevitable big moves.
5. Volume: Your Market Truth Detector
Volume is the most underutilized indicator among amateur traders, yet it’s the most important confirmation tool professionals use. Price can lie, but volume tells the truth about market conviction.
Volume Patterns That Matter:
- Breakout confirmation: High volume on breakouts = sustainable moves
- Exhaustion signals: Declining volume in trends = weakness
- Accumulation/Distribution: Volume patterns show smart money activity
- False breakouts: Low volume breakouts often fail
Professional Volume Analysis:
- Rising prices + rising volume = Strong uptrend
- Rising prices + falling volume = Weakening uptrend
- Falling prices + rising volume = Strong downtrend
- Falling prices + falling volume = Weakening downtrend
The Smart Money Secret: Professional traders and institutions can’t hide their footprints in volume. When you see unusual volume spikes, especially before major price moves, you’re seeing smart money in action. Learn to follow the volume, and you’ll follow the money.
Building Your Technical Analysis Trading System
Having the right indicators is only half the battle. The real edge comes from combining them into a coherent system that gives you clear entry and exit signals while managing risk.
The Professional’s 3-Step System
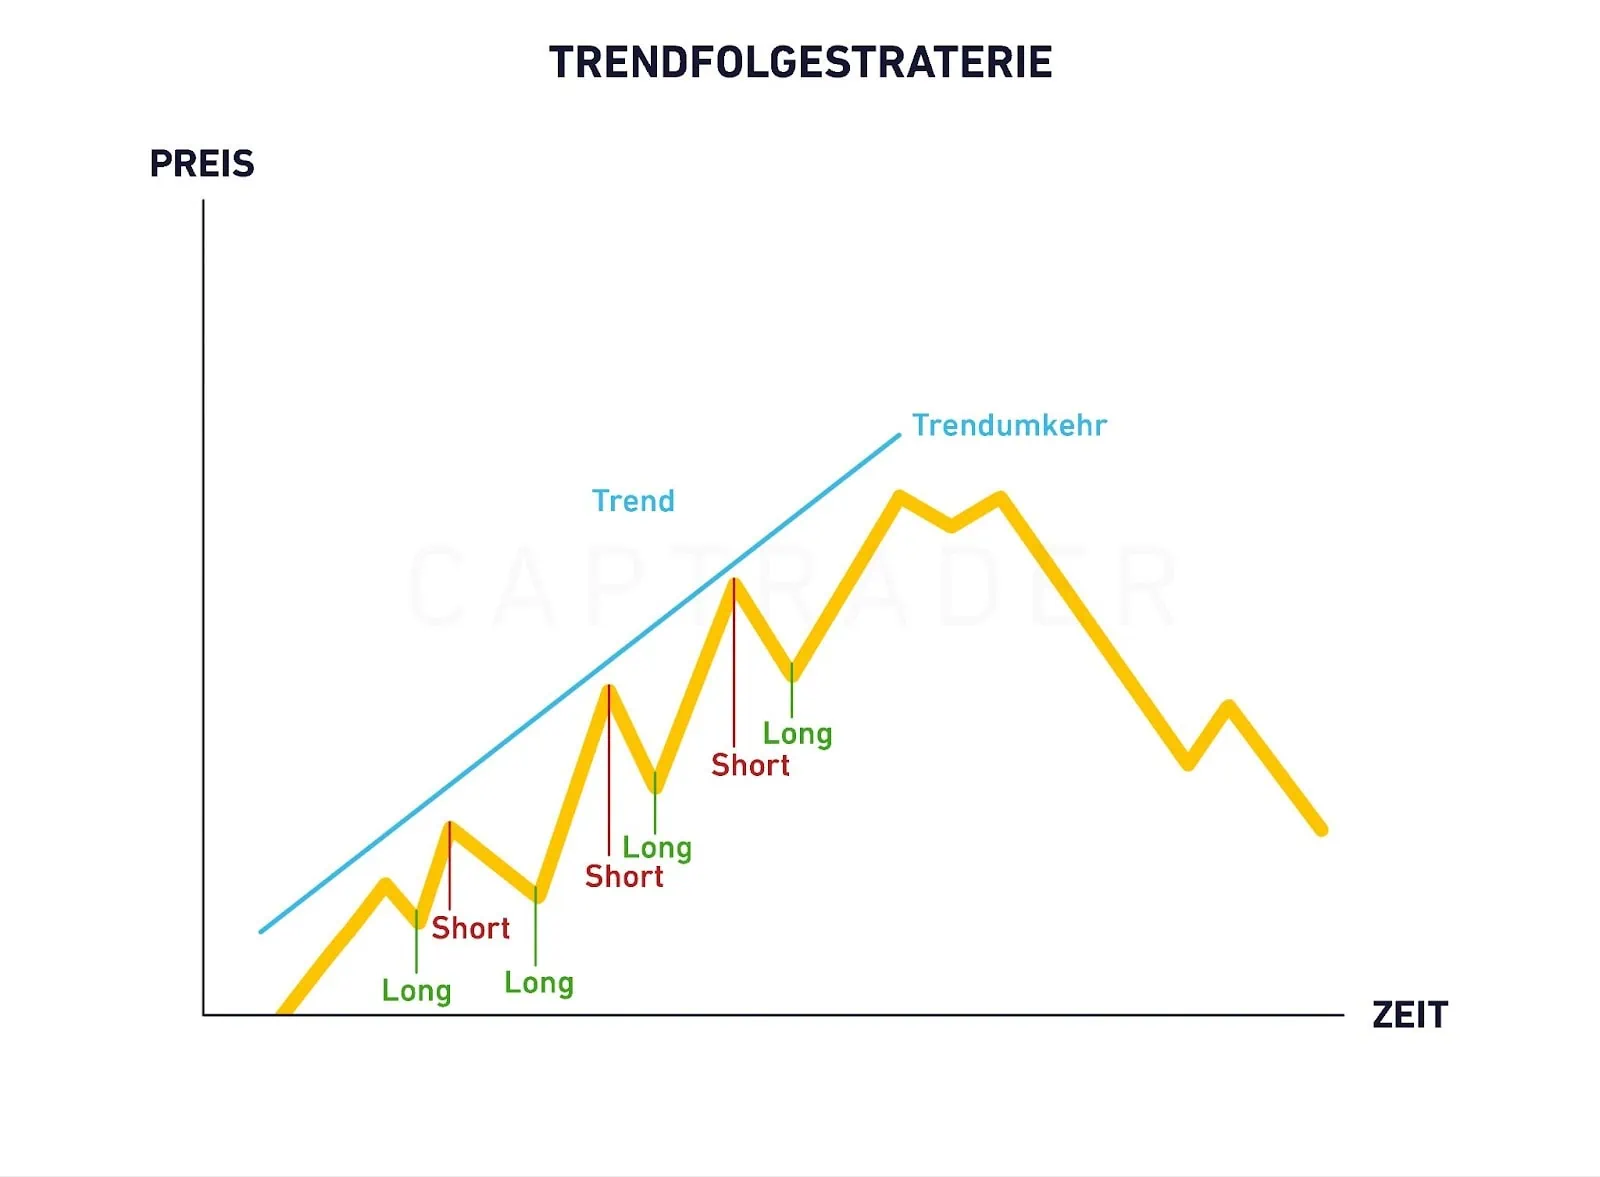
Step 1: Identify the Trend Use moving averages to determine the primary trend direction. Never fight the trend – it’s the closest thing to a free lunch in trading.
Step 2: Time Your Entry Use RSI and MACD to identify optimal entry points within the trend. Look for oversold conditions in uptrends and overbought conditions in downtrends.
Step 3: Confirm with Volume Volume must confirm your signal. Strong moves on weak volume are suspect. Wait for volume confirmation before committing significant capital.
Risk Management: Your Trading Insurance Policy
Technical analysis without proper risk management is like driving without a seatbelt. Here’s how professionals protect their capital:
Position Sizing Rules:
- Never risk more than 1-2% of your account on any single trade
- Use smaller positions when indicators give mixed signals
- Increase position size when multiple indicators align
Stop Loss Placement:
- Place stops below key support levels in long positions
- Use technical levels, not arbitrary percentages
- Adjust stops as the trade moves in your favor
Profit Taking Strategy:
- Take partial profits when RSI shows overbought conditions
- Use trailing stops to lock in gains during strong trends
- Have a plan for every trade before you enter
Common Technical Analysis Mistakes That Cost Traders Money
Learning what not to do is often more valuable than learning what to do. Here are the costly mistakes that separate amateur traders from professionals:
Indicator Overload Syndrome
The biggest mistake new traders make is using too many indicators. Your chart shouldn’t look like a Christmas tree. More indicators don’t equal better signals – they equal confusion and paralysis.
Solution: Master these five indicators before adding any others. Quality over quantity, always.
Ignoring Market Context
Technical indicators work differently in trending markets versus ranging markets. RSI overbought signals might be meaningless in a strong uptrend, while breakouts from Bollinger Bands might fail in choppy conditions.
Solution: Always consider the broader market context. Are we in a bull market or bear market? Is volatility high or low? Adjust your interpretation accordingly.
Emotional Override
Having perfect technical signals means nothing if you don’t have the discipline to follow them. Emotional trading is the fastest way to turn a profitable system into a losing one.
Solution: Develop a trading plan and stick to it. If your technical analysis says sell, sell. If it says buy, buy. Trust the process.
Lack of Patience
Technical analysis requires patience. The best setups don’t happen every day, and forcing trades leads to poor results. Professional traders wait for high-probability setups and pass on everything else.
Solution: Quality over quantity. It’s better to make 10 great trades than 100 mediocre ones.
The Future of Technical Analysis: What’s Coming in 2025 and Beyond
As we look ahead, several trends will reshape how traders use technical analysis:
AI-Enhanced Pattern Recognition
Machine learning algorithms are becoming better at identifying complex patterns that human traders might miss. However, they still rely on the same fundamental technical principles.
Real-Time Sentiment Integration
Modern platforms are beginning to integrate social media sentiment and news flow with traditional technical indicators, providing a more complete picture of market dynamics.
Cross-Asset Analysis
Today’s markets are increasingly interconnected. Professional traders are using technical analysis across multiple asset classes simultaneously to identify opportunities and manage risk.
Mobile-First Trading
The future of trading is mobile, and technical analysis tools are becoming more sophisticated and accessible on smartphones and tablets.
Ready to Transform Your Trading with Technical Analysis?
Technical analysis in 2025 isn’t about predicting the future – it’s about positioning yourself to profit from the most probable outcomes while managing risk. The traders who succeed will be those who master these fundamental tools and apply them with discipline and patience.
The opportunity is real, but so is the learning curve. Start with these five indicators, practice on paper or with small positions, and gradually build your skills and confidence.
Your Technical Analysis Action Plan:
- Master one indicator at a time – Start with moving averages
- Practice on historical charts – Develop pattern recognition skills
- Start with small positions – Learn without risking significant capital
- Keep a trading journal – Track what works and what doesn’t
- Stay disciplined – Follow your system regardless of emotions
Getting Started Today:
- Choose a reputable trading platform with robust charting tools
- Set up your charts with the five indicators covered in this guide
- Start with major stocks or ETFs (they have cleaner technical patterns)
- Practice identifying patterns and signals before risking real money
- Join trading communities to learn from experienced practitioners
Remember: Technical analysis is a skill that improves with practice. The sooner you start, the sooner you’ll develop the expertise that separates winning traders from the crowd.
The markets are waiting, and the tools are at your fingertips. Your technical analysis journey begins now.
Disclaimer: This content is for educational purposes only and should not be considered financial advice. Trading involves substantial risk and is not suitable for all investors. Always consult with a qualified financial advisor before making investment decisions.
About TradingInsights.com: Your trusted source for technical analysis education, trading strategies, and market insights. Master the markets with confidence, trade with discipline, and build your financial future through technical excellence.